0
items
$0


Vermont's Great Retreat

To begin the process of creating this map, I asked questions. Devoured books. Consumed articles. Talked to historians and librarians. And read maps. Lots of maps. As I did, I wondered if there was something in the landscape, the communities, the culture that made Vermont unwelcoming, if not hostile, to African Americans? An historian directed me to U.S. Census data, which I examined, plotted as coordinates onto a graph, then connected into a slope. The slope signified a striking decline of the Black population over time and reminded me of the eastern border of a sideways Vermont with east up. I figured I could use that. Distort that. I mean, graphs do. That’s how graphs work. And maps distort all the time. Every time, in fact. Graphic distortion is part of what makes a map a map. So that’s what I did. But I did it in a way to emphasize — underscore — my point … or series of points. I drew Vermont’s eastern border as a coordinated, plotted, distorted slope to focus the reader’s attention on the historic exodus of her Black citizens during the height of the Jim Crow North.
I then applied Umberto Eco’s axiom: “assume the intelligence of the reader,” which was why I didn’t include a more recognizable detail of Vermont with north up to orient the reader. I wanted the reader to work and discover. Meanwhile, I applied Louis Sullivan’s design principle of “Form follows function” but then took it further with Frank Lloyd Wright’s adaptation to Sullivan’s principle: “Form and function should be one, joined by a spiritual union.” My map is a spiritual union of form and function … graph and map … data and territory … time and space.
I believe maps can be used to change the world for the better. Heaven knows they have been used to bring about change for the worse. From colonizing powers claiming the territories and resources of others. To waging wars. To ethnic cleansings. To genocides. Maps have served the wealthy and powerful quite well over the past 500 years.
PROJECT BACKGROUND
I began this project envisioning George Orwell’s essay, “Why I Write”
My starting point is always a feeling of partisanship, a sense of injustice. When I sit down to write a book, I do not say to myself, “I am going to produce a work of art”. I write it because there is some lie that I want to expose, some fact to which I want to draw attention, and my initial concern is to get a hearing. (1946)
As it was with Orwell and writing, so it was with me and map-making: I wanted to expose a lie … draw attention to some fact … project a light onto an injustice deeply buried or hidden in plain sight.
But, as with any project, in the beginning, I had to ask myself, What to do?
I had no idea.
But I did have an idea that life in Vermont was not as joyful as many presented it, such as certain illustrations found on Ben & Jerry’s ice cream cartons: happy cows grazing across quirky, friendly, progressive landscapes. I knew there was more to these off-beat Green Mountains. Something in the gaps. Something darker deposited below the surface. And yet, something very much alive and well and thriving to this day. I wanted to mine this landscape. Expose it. Shed light upon it. And then, in the end, get a hearing. Guerrilla Cartography offered me this.
As I pored over the Census data and the extant research, I was also reading Craig Steven Wilder’s Ebony and Ivy: Race, Slavery, and the Troubled History of America’s Universities. When Wilder mentioned that a road leading to Dartmouth College was named “Ni**er Hill,” and that merely a stone’s throw away from that road was an island named “Ni**er Island,” I took note. Lots of notes, actually, because I lived only five miles from this road, that island, and Dartmouth, just across the river, in Vermont. I wondered, since New Hampshire had racist place-names, might Vermont also? These are, after all, the Twin States. And, if so, what would that reveal about the history and culture of this region? Might that help explain why our Black friends left the state with no intention of returning? Or why others, terrorized in Bennington and Rutland, moved to Burlington? Or why there have been so many signs of hate, to say nothing of reports of other actions of intolerance here?
It didn’t take much digging before I struck a motherlode of racist place-names near Marshfield where old, and not-so-old, maps read: Ni**erhead Mountain, Ni**erhead Ledge, Ni**erhead Brook, and Ni**erhead Pond. It took no imagination whatsoever to consider what sort of community — or society — produced these place-names. Then, as if this could not get any worse, according to a 1966 New York Times article, the Chief Justice of Vermont’s Supreme Court urged the names to be changed. But The Board of State Library Trustees, who decided such matters, argued and voted to keep them. They voted to keep the racist place-names? Really? Of course they did.
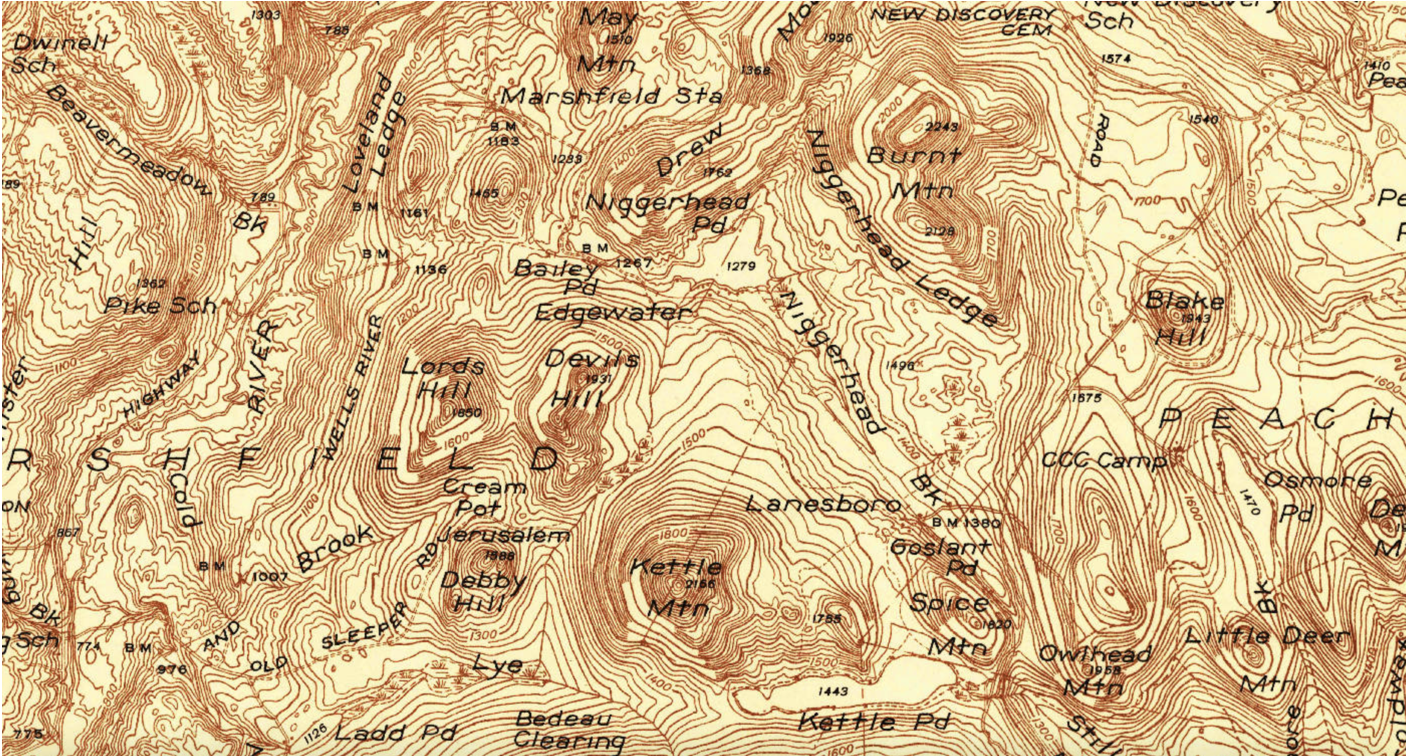
U.S. Geologic Survey. Plainfield quadrangle, Vermont [map]. 1:62,500. 15-Minute Series. Washington, D.C.: United States Department of the Interior. USGS, 1943.
As I began to map racist place-names in Vermont, I also started reading James Loewen’s engrossing, Sundown Towns: A Hidden Dimension of American Racism.
In Sundown Towns, Loewen described how, in late-1800s-Wyoming, Whites shot, burned alive, and further terrorized hundreds of Chinese children, women, and men as they were brutally driven out from their homes and communities. Wyoming’s White rage spread to Idaho where the population was, at the time, 30 percent Chinese. But not for long. As with Wyoming, so with Idaho. The ethnic cleansing carried out by White raging mobs across the states was swift, brutal, and thorough and I imagine with the same sort of misplaced, violent, raging, indignation as the January 6 Capitol Insurrection. Congress fled for shelter from the White mob — Trump’s mob — not unlike the ethnic Chinese of Wyoming and Idaho did from the Northern White mob.
Seeking shelter from Southern White terrorism, African Americans left as refugees en masse: an exodus of enormous proportions now known as The Great Migration. These former slaves and sharecroppers, laborers and professionals, settled in almost every Northern county of every Northern State. They built homes and farmed the land. Tragically, before long, they had to abandon their homesteads due to a violent, explosive, virulent form of Northern White racism that forced African Americans to seek shelter in urban centers across the country. In his book, Sundown Towns, Loewen called this mass movement of people, The Great Retreat and went on to explain how sundown towns, sundown counties, and sundown regions were primarily a Northern phenomenon and the rule rather than the exception, because any area or community in the North that was predominantly White was White for a reason (Loewen, 2008). Given these facts, Vermont, I felt, deserved a closer look.

Pitkin, C., (Editor). (n.d.). Marshfield, Vermont: A photographic album 1860–1930. Marshfield, VT: The Marshfield Historical Society.
EXPLORING THE DATA
When I explored the U.S. Census data from the Civil War to the present, I discovered a precipitous drop in Vermont’s Black population after 1910. This was consistent with similar drops elsewhere and violent patterns of ethnic cleansing by Northern Whites against Black people across the North. One disturbing detail, however, is that Vermont has not only been able to sustain its Whiteness … but become Whiter. Whiter to the point where it is currently the Whitest state in the Union. Why? What is it about Vermont that maintains its Whiteness so effectively, so thoroughly, so enduringly?
Michelle Alexander, in her classic, The New Jim Crow: Mass Incarceration in the Age of Colorblindness (2010), and Ava DuVernay in her film, 13th (2016), point out that systems of oppression are adaptable. Has Vermont, as a state system of oppression, adapted to be hostile to African Americans by design?
GUERRILLA CARTOGRAPHY MAP-MAKING PROCESS
While reflecting on Vermont’s precipitous drop in her Black population (as well as her inability to sustain one of any significance), I was reminded of Charles Minard’s famous 19th century map of the Napoleonic invasion of Russia.

Charles Joseph Minard. (2021, June 17). In Wikipedia. https://en.wikipedia.org/wiki/Charles_Joseph_Minard.
Minard’s skill in graphically capturing the loss of human life was profound, the numbers mind-boggling. His was the sort of map one never forgets. At least I never did. Inspired, I set out to recreate a Minardian map of my own. However, instead of depicting Napoleon’s retreat, I depicted that of Vermont’s Black citizens. A local diaspora. I think we White residents of Vermont have to ask ourselves, “Why is the flow of African Americans not the other way around? Why does Vermont hemorrhage those BIPOC who do move here? Why is Vermont the most hyper-segregated state in the Union?”

I began this project sketching data, coordinates, and a slope with a 314 pencil on bumwad. As my drawing developed, so did my concept. My map. I submitted a Rapidograph-and-ink-on-mylar-image-rough-draft before feedback from the Guerrilla Cartographers pushed me to do better and work this map out in Adobe Illustrator. Which I did, barely. They were right; the results, dramatic. Through the process of listening to feedback and resubmitting drafts, my map evolved … and with my map, so did I. I am grateful for the process and the hard labor of working with others.
Vermont’s Great Retreat sheds a light upon our past, exposes a history long buried or hidden in plain sight, and starts an argument about the urgency to make Vermont a safe, enriching, vibrant, and welcoming Commonwealth for everyone equally and equitably.
ABOUT THE CARTOGRAPHER
I grew up in the mountains of northeast-central Pennsylvania but now live in Vermont. I work as a counter-cartographer, artist, and educator. During the day, I teach Physical Education and Art at Springfield High School. During my evenings, I serve as an adjunct instructor at the Community College of Vermont (CCV) where I mostly teach a first-semester seminar but have taught other courses in the fields of Art, Geography, Sociology, and Education. For my in-person classes, I integrate art and mapping into the curriculum to better engage students and help improve student retention. I have been a member of the Vermont Filmmakers Collective and my wife and I are presently collaborating on a short film about racism in Vermont, and I serve on CCV’s Diversity, Equity, and Inclusion Task Force.

Photo by Dave Jones
Meanwhile, through a grant from the Vermont Arts Endowment Fund, I am creating a narrative atlas of Bellows Falls. Last year, my map, White Elephants in the State of Vermont, was published in Guerrilla Cartography's Community Atlas. In 2018, I was the Artist-in-Residence at Keene State College where I facilitated a counter-cartographic, participatory-mapping, community-engagement art project in which participants addressed issues of domestic violence, access to downtown public restrooms, city-wide solar energy, and Keene public art.
I make maps to explore, figure things out, and confront White supremacy.
Vermont's Great Retreat is dedicated to the memory, energy, and work of Dr. James Loewen.
REFERENCES
Alexander, M. (2010). The new Jim Crow: Mass incarceration in the age of colorblindness. The New Press.
Charles Joseph Minard. (2021, June 17). In Wikipedia. https://en.wikipedia.org/wiki/Charles_Joseph_Minard.
DuVernay, A. (2016). 13th. Kandoo Films.
Eco, U. (1984). The role of the reader. Indiana University Press.
Loewen, J. (2008). Sundown towns: A hidden dimension of American racism. The New Press.
Orwell, G. (2021, June 17). Why I write. The Orwell Foundation. https://www.orwellfoundation.com/the-orwell-foundation/orwell/essays-and-other-works/why-i-write/
Pitkin, C., (Editor). (n.d.). Marshfield, Vermont: A photographic album 1860–1930. Marshfield, VT: The Marshfield Historical Society.
UPI, (1966). Vermont mountain to retain its name. The New York Times, (22).
U.S. Geologic Survey. Plainfield quadrangle, Vermont [map]. 1:62,500. 15-Minute Series. Washington, D.C.: United States Department of the Interior. USGS, 1943.
