
My career has been a diverse mix of my two professional passions, cartography and participatory mapping. Cartography is about the place; it’s top-down; it’s authoritative, it’s scientific, and (as you shift from GIS to cartography) it’s artistic. Participatory mapping is about the people; it’s bottom-up, it’s representative, and it’s a form of intimate cartographic collaboration. The balance of these two decidedly distinct types of mapping is where I see myself fit as a guerrilla cartographer.
For my map for “Water: An Atlas”, I wanted to address sea level rise (SLR) in the Eastern Caribbean small island developing states (SIDS) of Saint Vincent and the Grenadines (SVG) and Grenada, where I’ve lived and worked since 2011. The geospatial data that I chose to use on my map was created through analyses by The Nature Conservancy which, in turn, was used by the local community on Union Island, SVG (partnering with local and international organizations) alongside a participatory three-dimensional model (P3DM) to dramatically demonstrate how as little as a one meter and two meter SLR could impact these tiny islands. I have also experimented with this powerful SLR dataset on my own in the past to look at the damage that could be caused to major villages, visualizing the homes, government offices, businesses, churches, cemeteries, museums, marine ports, and airports that could be flooded should we experience SLR at these levels.

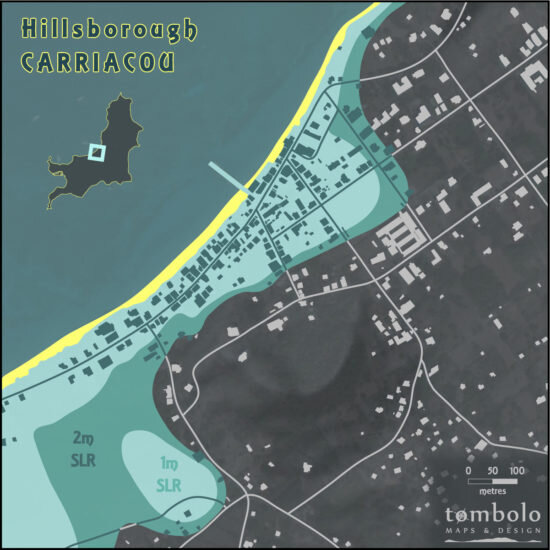
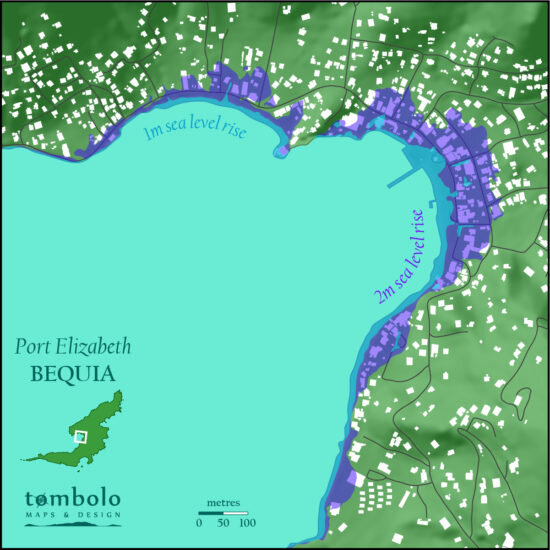
When I saw the call for “water” themed maps, I knew this was the data that I needed to use. It is rare to have quality data for this part of the world. Usually analyses aren’t done at the scale required to visualize how these islands could be affected. You look at the Caribbean and you see the flat, low-lying coralline islands (e.g. the Bahamas, Barbados) are underwater and the more mountainous volcanic islands (e.g. Dominica, St. Lucia, St. Vincent, Grenada) appear largely unscathed. However, this broad analysis completely misses the mark. Roughly 70% of the population of the Caribbean resides near the coast, in the narrow strip of land right next to the ocean. There is an extreme coastal concentration of the population, transportation and trade networks, political centers, and emergency services which puts significant pressure on the coastal zone, and often the mountainous terrain doesn’t allow for people to (easily) retreat further inland.
As I note on my atlas page: while, at a global scale, the effects of SLR on SIDS are very small, the relative impacts for islands in the Caribbean are high. The world’s countries have agreed to attempting to limit global temperature increases to 2°C above pre-industrialization levels, however global SIDS came together to launch a climate justice campaign arguing that 2°C would have catastrophic impacts on SIDS and that we should instead aim for no higher than 1.5°C above pre-industrialization levels. While that half-degree may seem minor, coastal areas could see an extra 0.1 meter (10 cm) in SLR between those two temperatures, and research has shown that significant changes will be seen in essential areas of the coastal zone following as little as a 0.5–1 meter rise in sea level. Caribbean islands have contributed to less than one percent of global greenhouse gas emissions, however SIDS will almost certainly be the first countries exposed to the effects of climate change. (If you want to learn more, check out the United Nation’s Intergovernmental Panel on Climate Change (IPCC) special report on the impacts of global warming of 1.5 °C above pre-industrial levels and related global greenhouse gas emission pathways: https://www.ipcc.ch/sr15/).

Artwork Credit: Jonathan Gladding
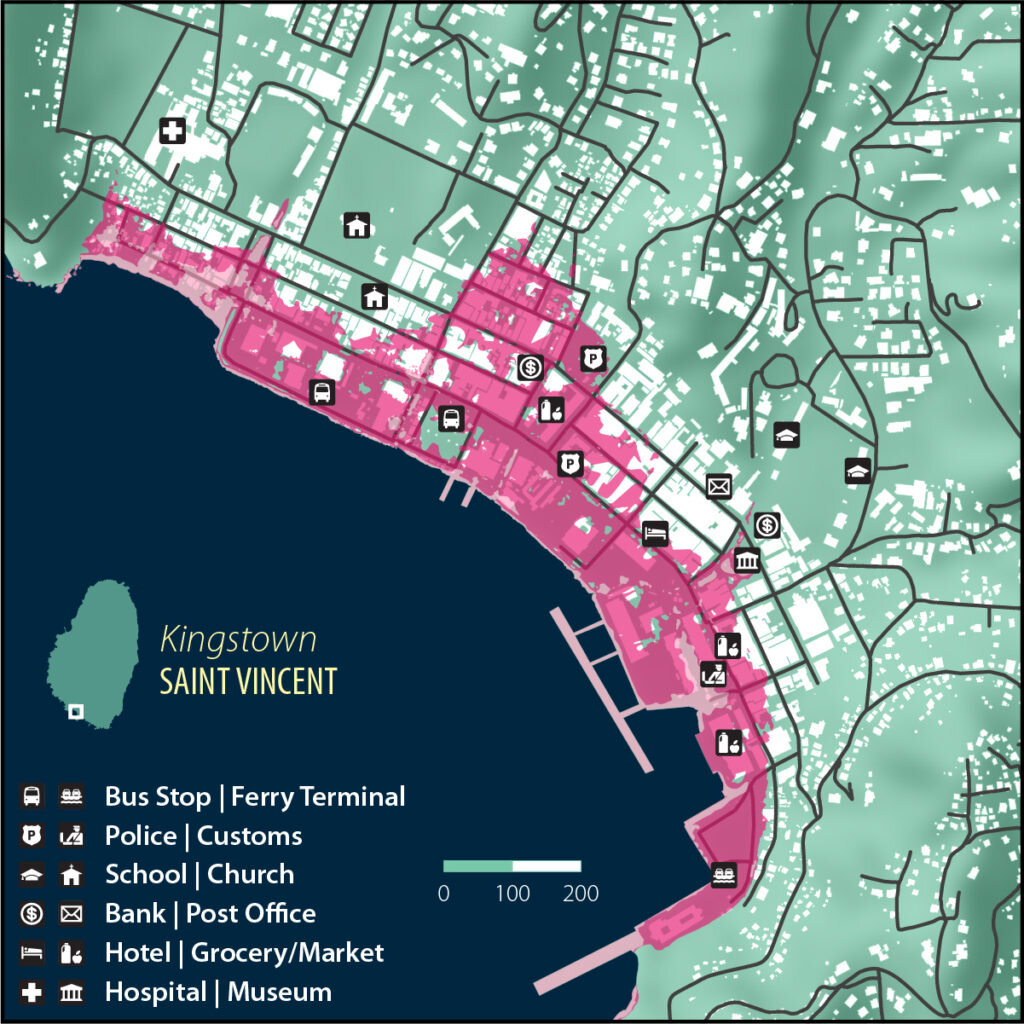
I made the cartographic decision to show terrain, roads, and buildings on these maps because I wanted to ensure that these points were made about SLR in the Caribbean. More importantly though, I pulled out inset maps that zoom in on essential hubs on a few of the larger islands. To give you a deeper examination of the capital of Saint Vincent and the Grenadines, I’ve added additional detail to my inset map for Kingstown, with a few important services highlighted that would be impacted by SLR.
My hope for my map in “Water: An Atlas” was to drive a conversation on climate change and sea level rise on small islands, using the specific example of two Eastern Caribbean countries. SIDS are disproportionately vulnerable to climatic events affecting their populations and gross domestic product in comparison to other places in the world, and—alongside disaster risk reduction and climate change adaptation—global education on this subject is important!

Special thanks to The Nature Conservancy for making this incredible dataset publicly available (explore it here: https://maps.coastalresilience.org/gsvg/) as well as to my graduate school professor, Dr. Michelle Mycoo, at the University of the West Indies for her course on Planning in the Coastal Zone which allowed me to dive further into my thesis research on climate change in SIDS.